Dashboard Overview - Your Control Center
When you log in to StatusPage.me, your dashboard is the first thing you see. It’s a quick operational snapshot plus shortcuts to the most common actions.
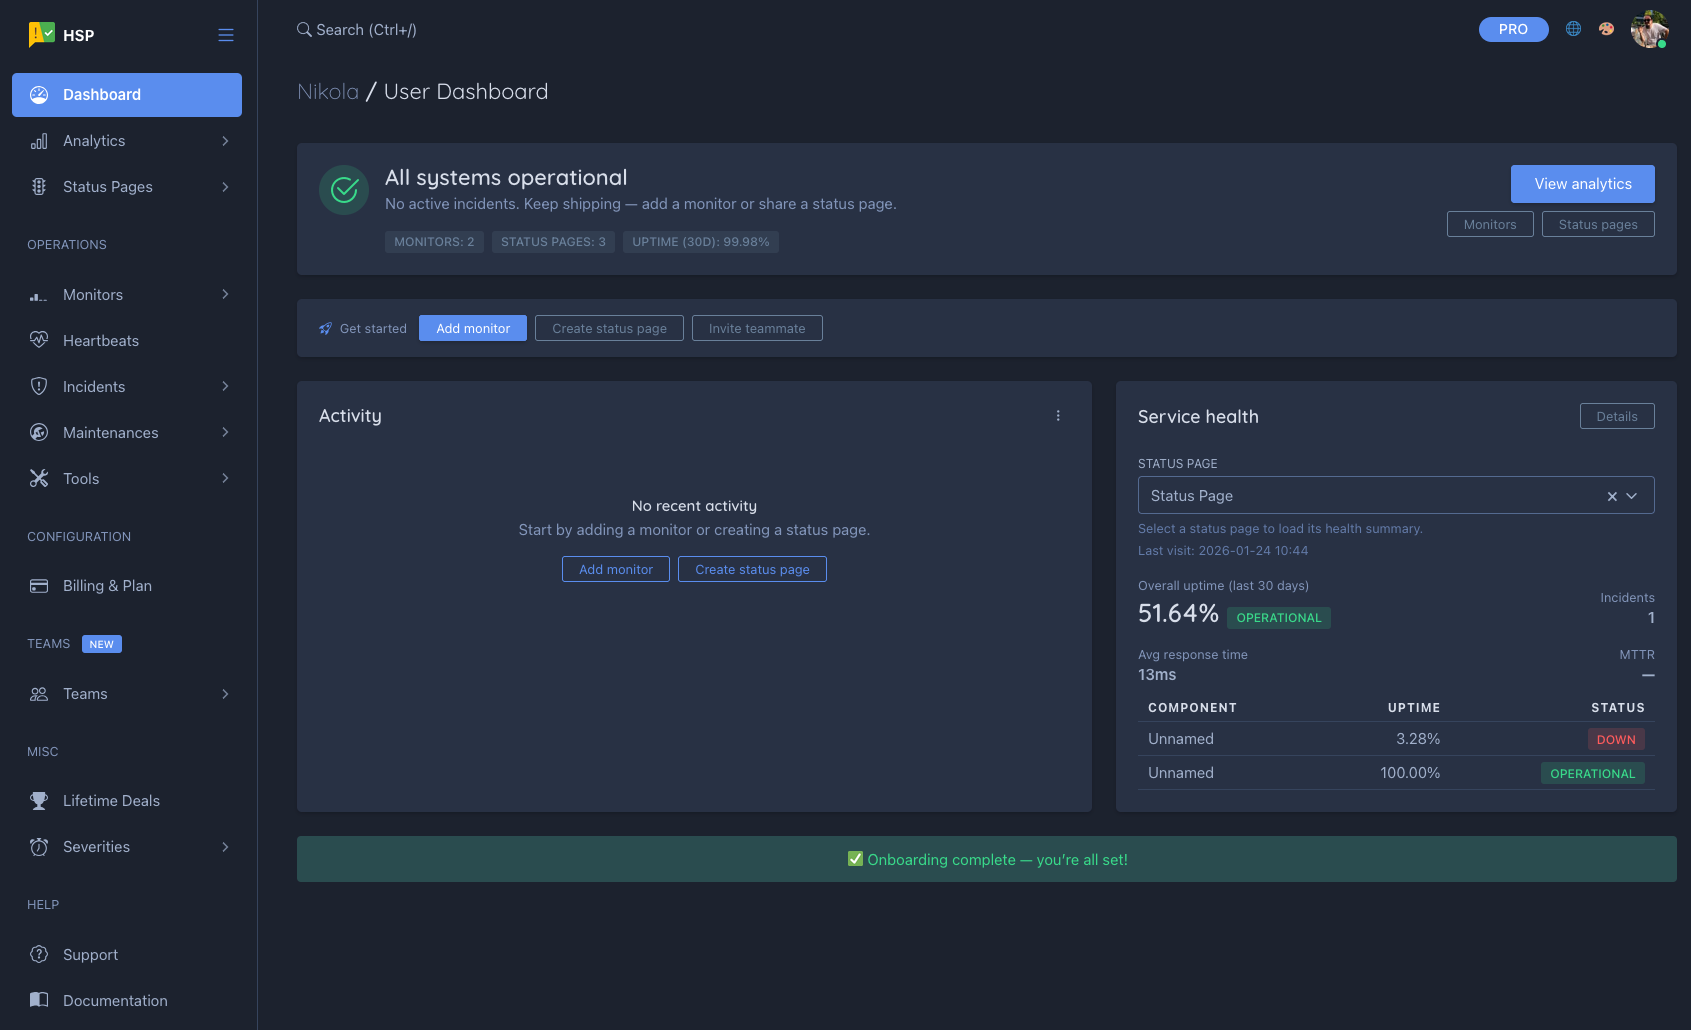
Top Summary Banner
At the top you’ll see a single status banner (for example All systems operational). Under it are quick, always-up-to-date metrics such as:
- Monitors (count) — see Set up your first monitor
- Status pages (count) — see Create your first status page
- Uptime (30d) (your recent uptime percentage)
On the right, the View analytics button jumps you straight into the Analytics dashboard for the selected status page.
Quick Actions
Just below the summary banner there’s a compact action bar with shortcuts like:
- Get started (onboarding/next steps)
- Add monitor — see Set up your first monitor
- Create status page — see Create your first status page
- Invite teammate — see Teams
Use these when you want to take action without navigating the sidebar.
Activity
The Activity card shows what’s been happening recently across your account (incidents, updates, configuration changes, and other key events). If there’s nothing recent, you’ll see an empty state with a couple of suggested actions.
If you’re new to incident workflows, start with Creating and managing incidents.
Service Health
The Service health panel is a fast “at-a-glance” view for a selected status page. It typically includes:
- A Status page selector
- Last updated timestamp
- Overall uptime (last 30 days) plus current state badge
- Avg response time
- Incidents count and MTTR (when available)
- A small table of components with their uptime and status (see Components & groups)
Onboarding Status
New accounts may see onboarding guidance. Once you’ve finished setup, the dashboard shows a confirmation banner like Onboarding complete — you’re all set!
What’s Next?
Ready to get started? Here are some good next steps: